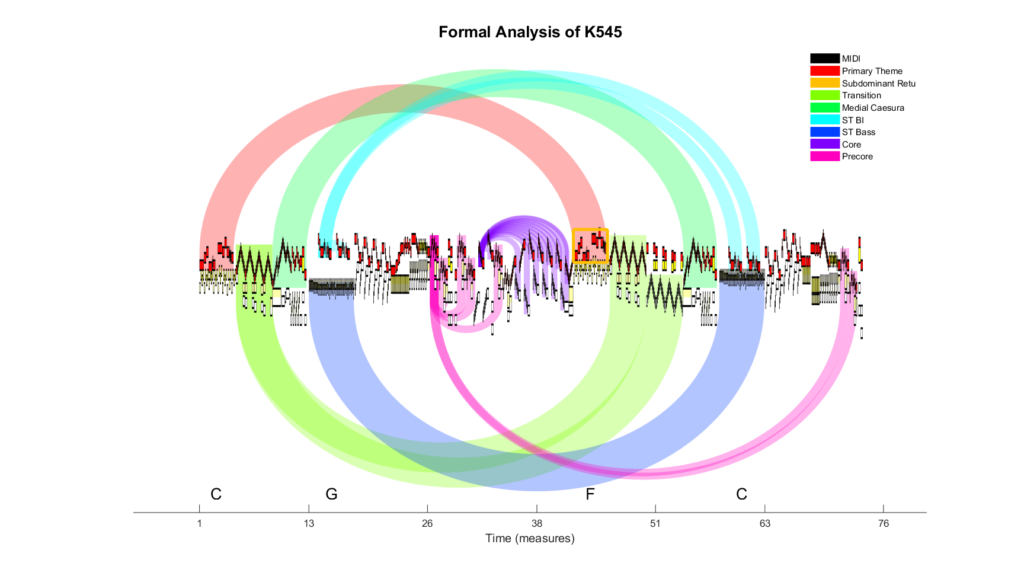
Music visualization offers new ways of understanding music. One example is an arc diagram (as shown above), first applied to music by Martin Wattenberg in his Shape of Song project. Our project, Algorithmic Thinking, Analysis, and Visualization in Music (ATAVizM), combines elements of previous work with (1) pattern recognition based on heuristics from music theory, (2) theme identification by users integrated into the application, and (3) visualization enhancements (like color-coding of themes) that make arc diagrams utilitarian for research and teaching.
In 2019, ATAVizM was the basis of a course module at southeastern colleges and universities, including Emory University, Florida State University, Morehouse College, Spelman College, and the University of Georgia. ATAVizM engages the user in a critical dialogue with technology, making the distinction between a pattern discovered by the algorithm, and a theme chosen by the user based on her/his analysis of the piece.
Download the Desktop Version from the Atlanta University Center’s RADAR or try out our developing web app hosted by Heroku.